转自: https://blog.csdn.net/u014769864/article/details/71545588
MarkerView
MPAndroidChart 系列:
MPAndroidChart 之LineChart(1)
MPAndroidChart之LineChart(2)MarkerView
MPAndroidChart之LinChart(3)scale缩放
对于MPAndroidChart的基本属性和一些常见的设置前面的一篇博客MPAndroidChart之LineChart(1) http://www.ramlife.org/2021/12/05/479.html 大部分说到了,这篇将要实现MarkerView这个东西,我理解是提示覆盖物,类似百度地图的覆盖物同一个意思,至于其他啥啥的,可以评论里吐口水大笑。
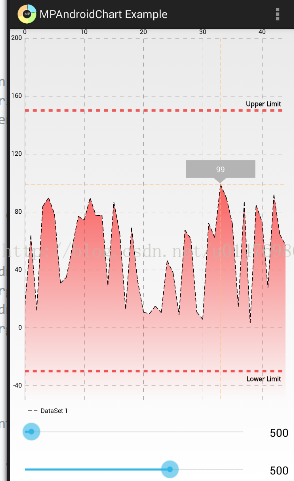
下面是官方demo里LineChart图表,那个99提示就是MarkerView
而我要实现自己的makerview,如下gif图的左边、右边、底部随着左右滑动显示的提示:
我们先实现官方那种makerview,这个很简单,这个其他博客也挺多都说了,我这里还是说一下
1、首先定义好你要显示的markerview的样子是什么样的xml,比如
    <?xml version="1.0" encoding="utf-8"?>
    <RelativeLayout xmlns:android="http://schemas.android.com/apk/res/android"
        android:layout_width="match_parent"
        android:layout_height="match_parent">

            <TextView
                android:id="@+id/tvContent"
                android:layout_width="wrap_content"
                android:layout_height="wrap_content"
                android:layout_centerHorizontal="true"
                android:layout_marginTop="7dp"
                android:layout_marginLeft="5dp"
                android:layout_marginRight="5dp"
                android:text=""
                android:textSize="12dp"
                android:textColor="@android:color/white"
                android:ellipsize="end"
                android:singleLine="true"
                android:textAppearance="?android:attr/textAppearanceSmall" />

    </RelativeLayout>
想定义什么样的markview就在上面的xml里面定义就好了
2、接下来是继承markerview然后重写refreshContent方法和getOffset方法
    package com.mpandroidchartcsdn.mychart;

    import android.content.Context;
    import android.widget.TextView;

    import com.github.mikephil.charting.components.MarkerView;
    import com.github.mikephil.charting.data.Entry;
    import com.github.mikephil.charting.highlight.Highlight;
    import com.github.mikephil.charting.utils.MPPointF;
    import com.github.mikephil.charting.utils.Utils;
    import com.mpandroidchartcsdn.R;

    public class MyMarkerView extends MarkerView {

        private TextView tvContent;

        public MyMarkerView(Context context) {
            super(context, R.layout.custom_marker_view);

            tvContent = (TextView) findViewById(R.id.tvContent);
        }

        // callbacks everytime the MarkerView is redrawn, can be used to update the
        // content (user-interface) 每次 MarkerView 重绘此方法都会被调用,并为您提供更新它显示的内容的机会
        @Override
        public void refreshContent(Entry e, Highlight highlight) {
            //这里就设置你想显示到makerview上的数据,Entry可以得到X、Y轴坐标,也可以e.getData()获取其他你设置的数据
            tvContent.setText("" + Utils.formatNumber(e.getY(), 0, true));
            super.refreshContent(e, highlight);
        }

        /*
     * offset 是以點到的那個點作為 (0,0) 中心然後往右下角畫出來 该方法是让markerview现实到坐标的上方
     * 所以如果要顯示在點的上方
     * X=寬度的一半,負數
     * Y=高度的負數
      */
        @Override
        public MPPointF getOffset() {
            // Log.e("ddd", "width:" + (-(getWidth() / 2)) + "height:" + (-getHeight()));
            return new MPPointF(-(getWidth() / 2), -getHeight());
        }

    }
3、在使用你自己定义的MyMarkerView
            MyMarkerView myMarkerView = new MyMarkerView(this);
            myMarkerView.setChartView(mLineChart);
            mLineChart.setMarker(myMarkerView);
OK,官方demo有,其他博客也很多如何定义MarkerView,这里就不细说了。

接下来说上图gif里的左右和底部makerview的实现,系好安全带,拖拉机要启动了....
上图gif里的实现是参考这篇博客“股票走势图” https://blog.csdn.net/qqyanjiang/article/details/51580629 系列来实现的,但是这位兄弟博客的股票走势图系列使用的MPAndroidChart版本很老了,6月份写的,现在我使用的最新版本3.0.2好多旧的api也不知道换成什么了,而且也只是贴了下代码。废话结束,下面开始gif里的markview的实现。
我们前面已经实现官方那种普通的markerview,它是显示在LineChart里面的,而我们下面要实现的是在轴的旁边,比如:“我想实现左边Y轴上显示markerview,如gif的左边一样”,那我们肯定要找画markerview的源码了,Ok
顺着我们继承的MarKerView里的方法refreshContent找到Chart类里的drawMarkers方法,恩,一看方法名大概就是它了,我们来看看它里面有些什么
      /**
         * draws all MarkerViews on the highlighted positions
         */
        protected void drawMarkers(Canvas canvas) {

            // if there is no marker view or drawing marker is disabled
            if (mMarker == null || !isDrawMarkersEnabled() || !valuesToHighlight())
                return;

            for (int i = 0; i < mIndicesToHighlight.length; i++) {

                Highlight highlight = mIndicesToHighlight[i];

                IDataSet set = mData.getDataSetByIndex(highlight.getDataSetIndex());

                Entry e = mData.getEntryForHighlight(mIndicesToHighlight[i]);
                int entryIndex = set.getEntryIndex(e);

                // make sure entry not null
                if (e == null || entryIndex > set.getEntryCount() * mAnimator.getPhaseX())
                    continue;

                float[] pos = getMarkerPosition(highlight);

                // check bounds
                if (!mViewPortHandler.isInBounds(pos[0], pos[1]))
                    continue;

                // callbacks to update the content
                mMarker.refreshContent(e, highlight);

                // draw the marker
                mMarker.draw(canvas, pos[0], pos[1]);
            }
        }
如果MPAndroidChart基本的设置熟悉的话,应该看得懂得,不懂就把每个不知道的打印出来,多试几次就懂了,这里我们一眼看过去最引人注意的就是 mMarker.refreshContent(e,highlight)和mMarker.draw(canvas,pos[0],pos[1])了,恩,没错,refreshContent(e,highlight)就是回调更新要显示的内容,这个暂时不管它,那只剩下mMarker.draw(canvas,pos[0],pos[1])了,马丹,就是你了,找了那么久,之前我说不懂参数是什么就打印多试试就明白了的。
canvas:画笔,pos[0]:x轴坐标,pos[1]:y轴坐标,
上面有X轴和Y轴坐标,那我想实现gif坐标那样的markerview,是不是把X轴设置0就可以了呢?OK,接下来我们试试把X轴换成0看看Y轴左边显示markerview的样子。
左边显示markerview步骤:
1、MarkerView xml
    <?xml version="1.0" encoding="utf-8"?>
    <RelativeLayout xmlns:android="http://schemas.android.com/apk/res/android"
        android:layout_width="match_parent"
        android:layout_height="match_parent">

        <TextView
            android:id="@+id/tvContent"
            android:layout_width="wrap_content"
            android:layout_height="wrap_content"
            android:background="#a0a0a0"
            android:paddingLeft="1dp"
            android:paddingRight="1dp"
            android:text=""
            android:textColor="@android:color/white"
            android:textSize="12sp" />

    </RelativeLayout>
2、继承MarkerView的类,和实现官方的那种markerview 一模一样,什么都没有变
    package com.mpandroidchartcsdn.mychart;

    import android.content.Context;
    import android.widget.TextView;

    import com.github.mikephil.charting.components.MarkerView;
    import com.github.mikephil.charting.data.Entry;
    import com.github.mikephil.charting.highlight.Highlight;
    import com.github.mikephil.charting.utils.MPPointF;
    import com.github.mikephil.charting.utils.Utils;
    import com.mpandroidchartcsdn.R;

    public class LeftMarkerView extends MarkerView {

        private TextView tvContent;

        public LeftMarkerView(Context context) {
            super(context, R.layout.custom_marker_view);

            tvContent = (TextView) findViewById(R.id.tvContent);
        }

        // callbacks everytime the MarkerView is redrawn, can be used to update the
        // content (user-interface) 每次 MarkerView 重绘此方法都会被调用,并为您提供更新它显示的内容的机会
        @Override
        public void refreshContent(Entry e, Highlight highlight) {
            //这里就设置你想显示到makerview上的数据,Entry可以得到X、Y轴坐标,也可以e.getData()获取其他你设置的数据
            tvContent.setText("" + Utils.formatNumber(e.getY(), 0, true));
            super.refreshContent(e, highlight);
        }

    }
3、这种需求我们最好不要去改源码,毕竟不是bug之类或者没办法什么的,so,重写drawMarkers方法就好了
    package com.mpandroidchartcsdn.mychart;

    import android.content.Context;
    import android.graphics.Canvas;
    import android.util.AttributeSet;

    import com.github.mikephil.charting.charts.LineChart;
    import com.github.mikephil.charting.data.Entry;
    import com.github.mikephil.charting.highlight.Highlight;
    import com.github.mikephil.charting.interfaces.datasets.IDataSet;

    /**
     * Created by tujingwu on 2017/5/4
     * .
     */

    public class MyLineChart2 extends LineChart {

        private LeftMarkerView myMarkerViewLeft;

        public MyLineChart2(Context context) {
            super(context);
        }

        public MyLineChart2(Context context, AttributeSet attrs) {
            super(context, attrs);
        }

        public void setMyMarkerView(LeftMarkerView leftMarkerView) {
            this.myMarkerViewLeft = leftMarkerView;
        }

        @Override
        protected void drawMarkers(Canvas canvas) {
            // if there is no marker view or drawing marker is disabled 这里记得把mMarker 改成自己的myMarkerViewLeft
            if (myMarkerViewLeft == null || !isDrawMarkersEnabled() || !valuesToHighlight())
                return;

            for (int i = 0; i < mIndicesToHighlight.length; i++) {

                Highlight highlight = mIndicesToHighlight[i];

                IDataSet set = mData.getDataSetByIndex(highlight.getDataSetIndex());

                Entry e = mData.getEntryForHighlight(mIndicesToHighlight[i]);
                int entryIndex = set.getEntryIndex(e);

                // make sure entry not null
                if (e == null || entryIndex > set.getEntryCount() * mAnimator.getPhaseX())
                    continue;

                float[] pos = getMarkerPosition(highlight);

                // check bounds
                if (!mViewPortHandler.isInBounds(pos[0], pos[1]))
                    continue;

                // callbacks to update the content
                myMarkerViewLeft.refreshContent(e, highlight);
                // draw the marker  这里我们把X轴原来的pos[0]改成0
                myMarkerViewLeft.draw(canvas, 0, pos[1]); //pos[]里面装的要draw的x:pos[0] draw的y:pos[1]
            }
        }
}好的,我们把源码里drawMarkers里的代码拷过来,并且把mMarker == null换成myMarkerViewLeft,mMarker.draw(canvas,pos[0],pos[1])换成mMarker.draw(canvas,0,pos[1])。什么事情都没做,接下来看看效果

可能有人注意到markerview显示的数据和Y轴对不上,这个我们没有设置当然对不上,但是在Y轴左边显示Markerview我们已经实现了不是吗生气,
不过有个问题:
4、修改
问个问题:
1、我们给X轴换成0了,虽然总体上没什么错,但是作为画上去东西是不是很奇怪?(如果自定义view熟练点的就大概知道把0换成什么的思路的)
就上面的问题可以这样来解决,毕竟MPAndroidChart也给了挺多东西的,我们把上面的MyLineChart2里的X/Y轴坐标换一下,其他代码还是没变:
    package com.mpandroidchartcsdn.mychart;

    import android.content.Context;
    import android.graphics.Canvas;
    import android.util.AttributeSet;

    import com.github.mikephil.charting.charts.LineChart;
    import com.github.mikephil.charting.data.Entry;
    import com.github.mikephil.charting.highlight.Highlight;
    import com.github.mikephil.charting.interfaces.datasets.IDataSet;

    /**
     * Created by tujingwu on 2017/5/4
     * .
     */

    public class MyLineChart2 extends LineChart {

        private LeftMarkerView myMarkerViewLeft;

        public MyLineChart2(Context context) {
            super(context);
        }

        public MyLineChart2(Context context, AttributeSet attrs) {
            super(context, attrs);
        }

        public void setMyMarkerView(LeftMarkerView leftMarkerView) {
            this.myMarkerViewLeft = leftMarkerView;
        }

        @Override
        protected void drawMarkers(Canvas canvas) {
            // if there is no marker view or drawing marker is disabled 这里记得把mMarker 改成自己的myMarkerViewLeft
            if (myMarkerViewLeft == null || !isDrawMarkersEnabled() || !valuesToHighlight())
                return;

            for (int i = 0; i < mIndicesToHighlight.length; i++) {

                Highlight highlight = mIndicesToHighlight[i];

                IDataSet set = mData.getDataSetByIndex(highlight.getDataSetIndex());

                Entry e = mData.getEntryForHighlight(mIndicesToHighlight[i]);
                int entryIndex = set.getEntryIndex(e);

                // make sure entry not null
                if (e == null || entryIndex > set.getEntryCount() * mAnimator.getPhaseX())
                    continue;

                float[] pos = getMarkerPosition(highlight);

                // check bounds
                if (!mViewPortHandler.isInBounds(pos[0], pos[1]))
                    continue;

                // callbacks to update the content
                myMarkerViewLeft.refreshContent(e, highlight);
                // draw the marker  这里我们把X轴原来我们设置0的换成mViewPortHandler.contentLeft() - myMarkerViewLeft.getWidth()
                //对于mViewPortHandler 官网wiki里:https://github.com/PhilJay/MPAndroidChart/wiki/The-ViewPortHandler有说明的
                myMarkerViewLeft.draw(canvas, mViewPortHandler.contentLeft() - myMarkerViewLeft.getWidth(),
    pos[1] - myMarkerViewLeft.getHeight() / 2); //pos[]里面装的要draw的x:pos[0] draw的y:pos[1]
            }
        }
    }
OK,我们来看看修改后的效果图
OK,虽然和上面的一张gif一样,但是我们成功把原来draw(canvas,pos[0],pos[1])换成了我们想要的,不是吗大笑
Y轴左边的markerview实现了,那Y轴右边和X轴底部的MarkerView或X轴顶部的MakerView也不在话下了,下面给出Y轴左右,X轴底部实现MarkerView的
代码
    package com.mpandroidchartcsdn.mychart;

    import android.content.Context;
    import android.graphics.Canvas;
    import android.util.AttributeSet;

    import com.github.mikephil.charting.charts.LineChart;
    import com.github.mikephil.charting.data.Entry;
    import com.github.mikephil.charting.highlight.Highlight;
    import com.github.mikephil.charting.interfaces.datasets.IDataSet;

    /**
     * Created by tujingwu on 2017/5/4
     * .
     */

    public class MyLineChart2 extends LineChart {

        private MyMarkerView myMarkerViewLeft;
        private BottomMarkerView myMarkerViewRight;
        private BottomMarkerView mMyBottomMarkerView;

        public MyLineChart2(Context context) {
            super(context);
        }

        public MyLineChart2(Context context, AttributeSet attrs) {
            super(context, attrs);
        }

        public void setMyMarkerView(LeftMarkerView leftMarkerView, RightMarkerView rightMarkerView, BottomMarkerView bottomMarkerView) {
            this.myMarkerViewLeft = leftMarkerView;
            this.myMarkerViewRight = rightMarkerView;
            this.mMyBottomMarkerView = bottomMarkerView;
        }

        @Override
        protected void drawMarkers(Canvas canvas) {
            // if there is no marker view or drawing marker is disabled 这里记得把mMarker 改成自己的myMarkerViewLeft
            if ( myMarkerViewLeft == null || myMarkerViewRight == null || mMyBottomMarkerView == null || !isDrawMarkersEnabled() || !valuesToHighlight())
                return;

            for (int i = 0; i < mIndicesToHighlight.length; i++) {

                Highlight highlight = mIndicesToHighlight[i];

                IDataSet set = mData.getDataSetByIndex(highlight.getDataSetIndex());

                Entry e = mData.getEntryForHighlight(mIndicesToHighlight[i]);
                int entryIndex = set.getEntryIndex(e);

                // make sure entry not null
                if (e == null || entryIndex > set.getEntryCount() * mAnimator.getPhaseX())
                    continue;

                float[] pos = getMarkerPosition(highlight);

                // check bounds
                if (!mViewPortHandler.isInBounds(pos[0], pos[1]))
                    continue;

                /**
                 *  mIndicesToHighlight[i]里面装的是某条线的数据
                 *如果想和该轴的数据对得上 可以自己添加个方法,像myMarkerViewLeft.setData(mIndicesToHighlight[i].getY());
                 * 然后在自己定义的markerview里接收就好
                 */
                // callbacks to update the content
                myMarkerViewLeft.refreshContent(e, highlight);
                myMarkerViewRight.refreshContent(e, highlight);
                mMyBottomMarkerView.refreshContent(e, highlight);
                // draw the marker  这里我们把X轴原来我们设置0的换成mViewPortHandler.contentLeft() - myMarkerViewLeft.getWidth()
                //对于mViewPortHandler 官网wiki里:https://github.com/PhilJay/MPAndroidChart/wiki/The-ViewPortHandler有说明的
                myMarkerViewLeft.draw(canvas, mViewPortHandler.contentLeft() - myMarkerViewLeft.getWidth(),
    pos[1] - myMarkerViewLeft.getHeight() / 2);
                myMarkerViewRight.draw(canvas, mViewPortHandler.contentRight(), pos[1] - myMarkerViewRight.getHeight() / 2);
                mMyBottomMarkerView.draw(canvas, pos[0] - mMyBottomMarkerView.getWidth() / 2, mViewPortHandler.contentBottom());
            }
        }
    }
然后使用MyLineChart设置Markerview
      LeftMarkerView leftMarkerView = new LeftMarkerView(this);
            RightMarkerView rightMarkerView = new RightMarkerView(this);
            BottomMarkerView bottomMarkerView = new BottomMarkerView(this);
            mLineChart.setMyMarkerView(leftMarkerView, rightMarkerView, bottomMarkerView);
最终效果

OK,现在想怎么显示自己的MarkerView都行了。
